Top Chart Analysis Techniques for Swing Traders in August 2026
Discover the best chart analysis techniques for swing traders in August 2026 to enhance your trading performance and decision-making.

Swing trading is a dynamic approach to trading that allows traders to capitalize on short- to medium-term price movements in various assets, including cryptocurrencies. As we navigate through August 2026, it's crucial for swing traders to refine their strategies using effective chart analysis techniques. This month, we will delve into specific methods that can enhance your trading performance, enabling you to make informed decisions while minimizing risks.
Understanding Swing Trading and Its Importance
Swing trading typically involves holding positions for several days to weeks, depending on the market's momentum. The goal is to capture a portion of an anticipated price move. Unlike day trading, which requires constant monitoring of the markets, swing trading allows traders to analyze price movements over a longer timeframe, making it less stressful and more manageable.
Key Benefits of Swing Trading
- Flexibility: Swing traders can operate on their schedules, allowing them to maintain a work-life balance.
- Reduced Stress: With longer holding periods, there’s less pressure compared to day trading, which often requires rapid decision-making.
- Potential for Higher Returns: By capturing larger price movements, swing traders can achieve significant profits.
The Role of Chart Analysis in Swing Trading
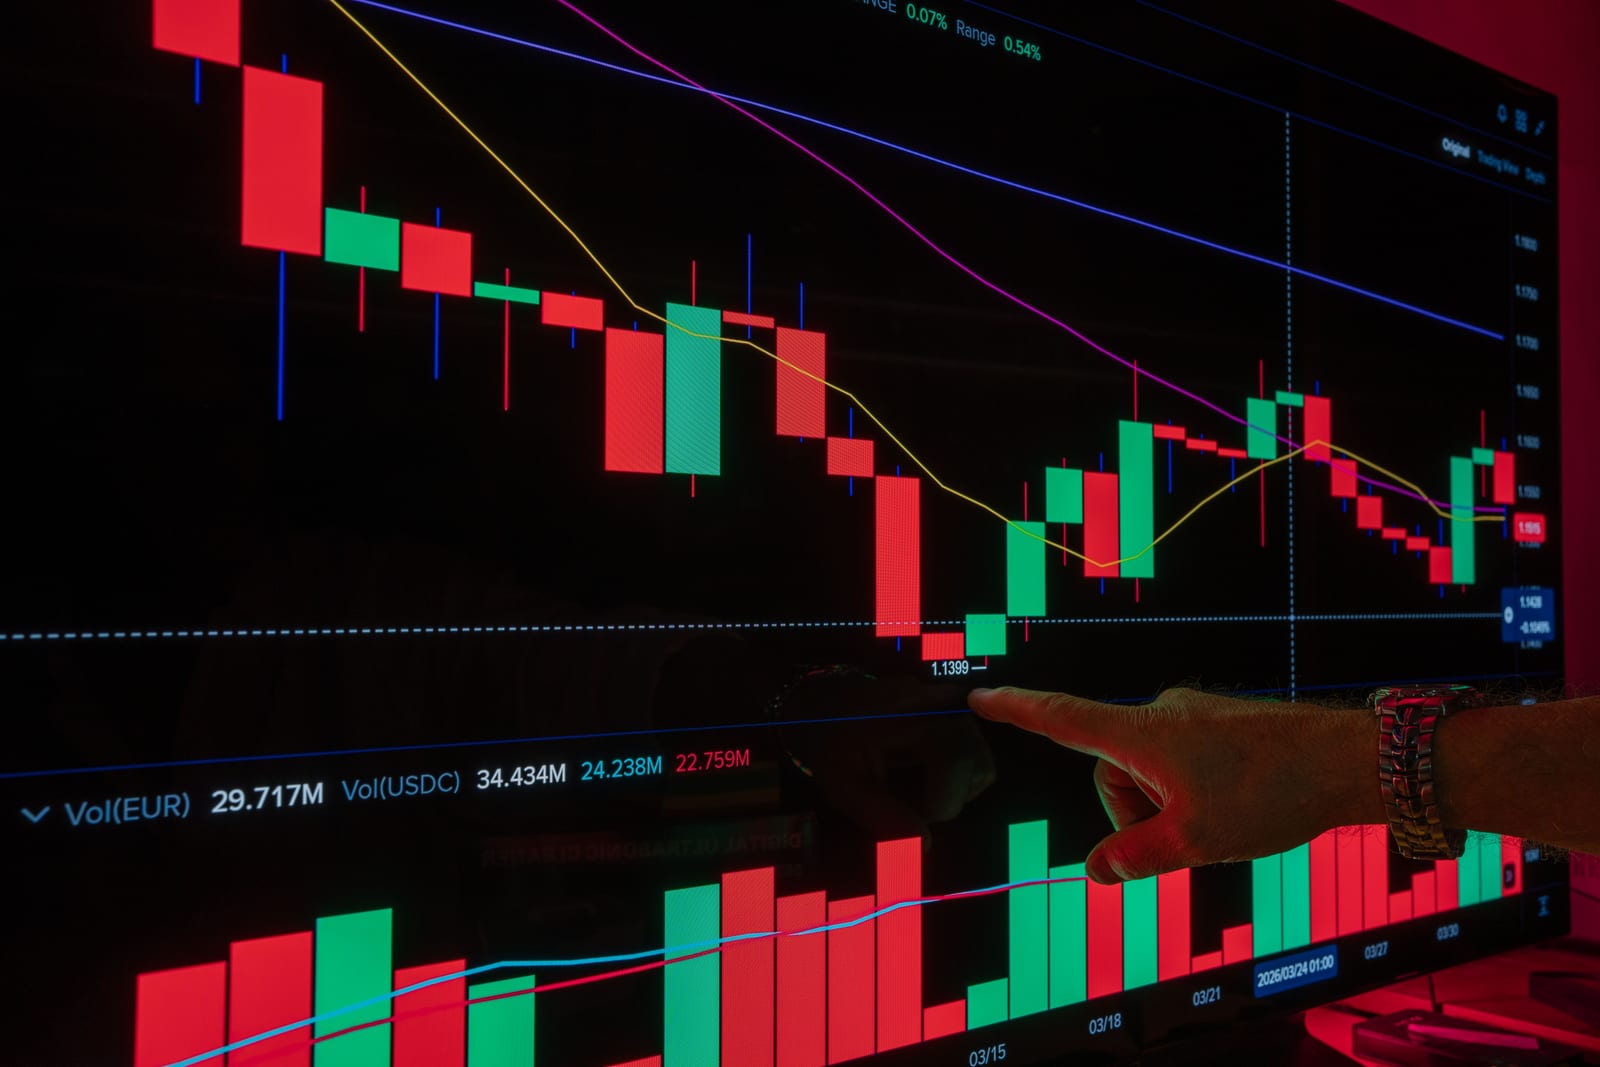
Chart analysis is fundamental for swing traders as it helps in identifying trends, support and resistance levels, and potential entry and exit points. In August 2026, the cryptocurrency market is particularly volatile, making effective chart analysis techniques essential for success. Here are some of the top techniques to consider:
1. Candlestick Patterns
Candlestick patterns are visual representations of price movements that provide insights into market sentiment. Understanding these patterns can significantly enhance your swing trading strategies.
Popular Candlestick Patterns for Swing Traders
- Bullish Engulfing: This pattern indicates a potential reversal from a downtrend to an uptrend, signaling a buying opportunity.
- Bearish Engulfing: Conversely, this pattern suggests a reversal from an uptrend to a downtrend, indicating a potential selling point.
- Doji: A doji candlestick shows indecision in the market. When combined with other indicators, it can suggest a trend reversal.
How to Use Candlestick Patterns
- Identify Patterns: Use candlestick charts to spot patterns that indicate potential reversals or continuations.
- Combine with Other Indicators: Enhance the reliability of these patterns by using them alongside technical indicators like RSI or MACD.
2. Moving Averages
Moving averages (MAs) are vital for smoothing out price data and identifying trends. They help swing traders determine the overall direction of the market.
Types of Moving Averages
- Simple Moving Average (SMA): The average price over a specific period, useful for identifying long-term trends.
- Exponential Moving Average (EMA): Places greater weight on recent prices, making it more responsive to new information.
Implementing Moving Averages in Swing Trading
- Crossovers: A bullish signal occurs when a short-term EMA crosses above a long-term SMA, while a bearish signal occurs when it crosses below.
- Support and Resistance: MAs can act as dynamic support and resistance levels, helping traders decide when to enter or exit trades.
3. Fibonacci Retracement Levels
Fibonacci retracement levels are a popular tool among swing traders for predicting potential reversal points in the market. These levels are derived from the Fibonacci sequence and can provide insights into where to place trades.
How to Use Fibonacci Retracement Levels
- Identify Trends: Begin by identifying the recent high and low of an asset. Draw the Fibonacci retracement levels between these points.
- Look for Confluence: Combine Fibonacci levels with other indicators or support/resistance levels to increase the probability of a successful trade.
Popular Fibonacci Levels to Watch
- 23.6%: A minor retracement level that can indicate a continuation of the trend.
- 38.2% and 61.8%: These levels are often watched closely for potential reversals.
4. Relative Strength Index (RSI)
The Relative Strength Index (RSI) is a momentum oscillator that measures the speed and change of price movements. It provides valuable insights into overbought or oversold conditions, which can be particularly useful for swing traders.
Utilizing RSI for Swing Trading
- Overbought and Oversold Conditions: An RSI above 70 indicates that an asset may be overbought, while an RSI below 30 suggests it may be oversold. This information can guide entry and exit points.
- Divergence: Look for divergences between the RSI and the price action. For example, if prices are making new highs while the RSI is failing to do so, it might signal a potential reversal.
5. Volume Analysis
Volume is a critical component of chart analysis that indicates the strength or weakness of a price movement. By analyzing volume, swing traders can gain insights into the sustainability of price trends.
Key Volume Indicators
- Volume Spikes: Sudden increases in volume often accompany significant price movements, indicating strong interest in the asset.
- Volume Trends: Analyzing volume trends can help traders confirm the strength of a trend. Increasing volume during an uptrend suggests strong bullish sentiment.
How to Incorporate Volume into Your Strategy
- Confirm Breakouts: Use volume to confirm breakouts. A breakout accompanied by high volume is more likely to be sustainable than one with low volume.
- Identify Reversals: Low volume during a price move can indicate a lack of conviction, suggesting a potential reversal.
6. Chart Patterns
Recognizing chart patterns is another essential technique for swing traders. These patterns can provide insights into potential future price movements.
Common Chart Patterns to Watch
- Head and Shoulders: This pattern indicates a potential reversal and is often seen at market tops.
- Double Tops and Bottoms: These patterns signal potential reversals and can be powerful indicators for swing traders.
- Triangles: Ascending, descending, and symmetrical triangles can indicate continuation or reversal patterns, depending on the breakout direction.
How to Trade Chart Patterns
- Entry Points: Use the completion of chart patterns as signals for entry points.
- Stop-Loss Placement: Place stop-loss orders just outside the pattern to manage risk effectively.
7. Combining Techniques for Enhanced Performance
While each of these chart analysis techniques is powerful on its own, combining them can provide even greater insights and enhance your swing trading performance. Here’s how you can integrate them effectively:
Multi-Factor Analysis
- Use Multiple Indicators: Don’t rely on a single indicator or pattern. Instead, use a combination of candlestick patterns, moving averages, and RSI to confirm your trading decisions.
- Backtesting: Before implementing a new strategy, backtest it using historical data to understand its effectiveness.
Developing a Trading Plan
- Set Clear Goals: Define your trading goals and risk tolerance before entering trades.
- Monitor and Adjust: Regularly review your trades and adjust your strategy based on performance and market conditions.
Conclusion
As August 2026 unfolds, swing traders have a unique opportunity to refine their trading strategies through effective chart analysis techniques. By utilizing candlestick patterns, moving averages, Fibonacci retracement levels, RSI, volume analysis, and chart patterns, traders can enhance their decision-making processes and improve their performance in the volatile cryptocurrency market.
Take Action Today
If you’re ready to take your swing trading to the next level, consider leveraging the tools and insights provided by Trnd Tools. Our platform offers real-time data, technical analysis, and macro insights tailored for serious traders. Create your free account today and start enhancing your trading strategy with structured insights and powerful tools.
FAQ
What is swing trading?
Swing trading is a trading strategy that involves holding positions for several days to weeks to capitalize on short- to medium-term price movements. It allows traders to take advantage of market volatility without the need for constant monitoring.
How do I choose the right chart analysis technique?
Choosing the right chart analysis technique depends on your trading style and goals. Consider factors such as your risk tolerance, time commitment, and market conditions. Combining multiple techniques can also provide more reliable signals.
What are the best indicators for swing trading?
Some of the best indicators for swing trading include moving averages, RSI, Fibonacci retracement levels, and volume analysis. Each of these indicators offers unique insights into market trends and can help traders make informed decisions.
How can I improve my swing trading performance?
Improving swing trading performance involves refining your strategies, continuously educating yourself, and utilizing effective chart analysis techniques. Regularly reviewing your trades and adjusting your approach based on market conditions can also lead to better results.
Is it necessary to use multiple techniques in swing trading?
While it’s not strictly necessary, using multiple techniques can enhance your trading strategy by providing confirmation and reducing the likelihood of false signals. A well-rounded approach can lead to more informed decision-making and improved performance.
Put it into practice in a trade journal
Log your crypto trades in Trnd Tools and see your real win rate, profit factor and which setups actually pay. Free for up to 10 trades a month, with 30 days of Pro on signup and no card required.
Start journaling freeOr see the trade journal tour and the free trading calculators.