How to Use Chart Analysis for Predicting Market Movements
Unlock the potential of chart analysis for market prediction. Learn effective techniques to enhance your trading strategy with Trnd Tools.

In the fast-paced world of cryptocurrency trading, making informed decisions is crucial for success. One of the most effective ways to enhance your trading strategy is through chart analysis for market prediction. By leveraging visual data representations, traders can identify trends, spot potential reversals, and make educated predictions about future price movements. In this article, we will explore the fundamentals of chart analysis, the various types of charts, key indicators to consider, and practical tips for implementing these techniques into your trading routine.
Understanding Chart Analysis
Chart analysis is a method used by traders to evaluate the historical price movements of an asset and make predictions about its future performance. It involves studying price charts, which visually represent the price changes of a cryptocurrency over time. The primary goal of chart analysis is to identify patterns and trends that can indicate potential market movements.
Why Use Chart Analysis?
- Visual Representation of Data: Charts provide a clear and concise way to visualize price movements, making it easier to spot trends and patterns.
- Trend Identification: By analyzing historical price movements, traders can identify bullish (upward) or bearish (downward) trends, which are critical for making informed trading decisions.
- Risk Management: Chart analysis helps traders set stop-loss orders and identify entry and exit points, reducing potential losses and maximizing profits.
- Market Psychology: Understanding market sentiment through chart patterns can give traders insights into the psychology of other market participants.
Types of Charts Used in Analysis
There are several types of charts that traders commonly use for chart analysis:
1. Line Charts
Line charts are the simplest form of chart, displaying the closing prices of an asset over a specified time period. They provide a clear visual representation of price movements but lack detailed information about price fluctuations within that period.
- Pros: Easy to read and understand, good for identifying long-term trends.
- Cons: Limited information; does not show volatility or price action during the trading period.
2. Bar Charts
Bar charts display the open, high, low, and close prices (OHLC) for a specific time frame, providing more information than line charts. Each bar represents a specific time period (e.g., hourly, daily) and includes:
Open: The price at the start of the period.
High: The highest price during the period.
Low: The lowest price during the period.
Close: The price at the end of the period.
Pros: More detailed information than line charts, useful for identifying price ranges and volatility.
Cons: Can be more complex for beginners to interpret.
3. Candlestick Charts
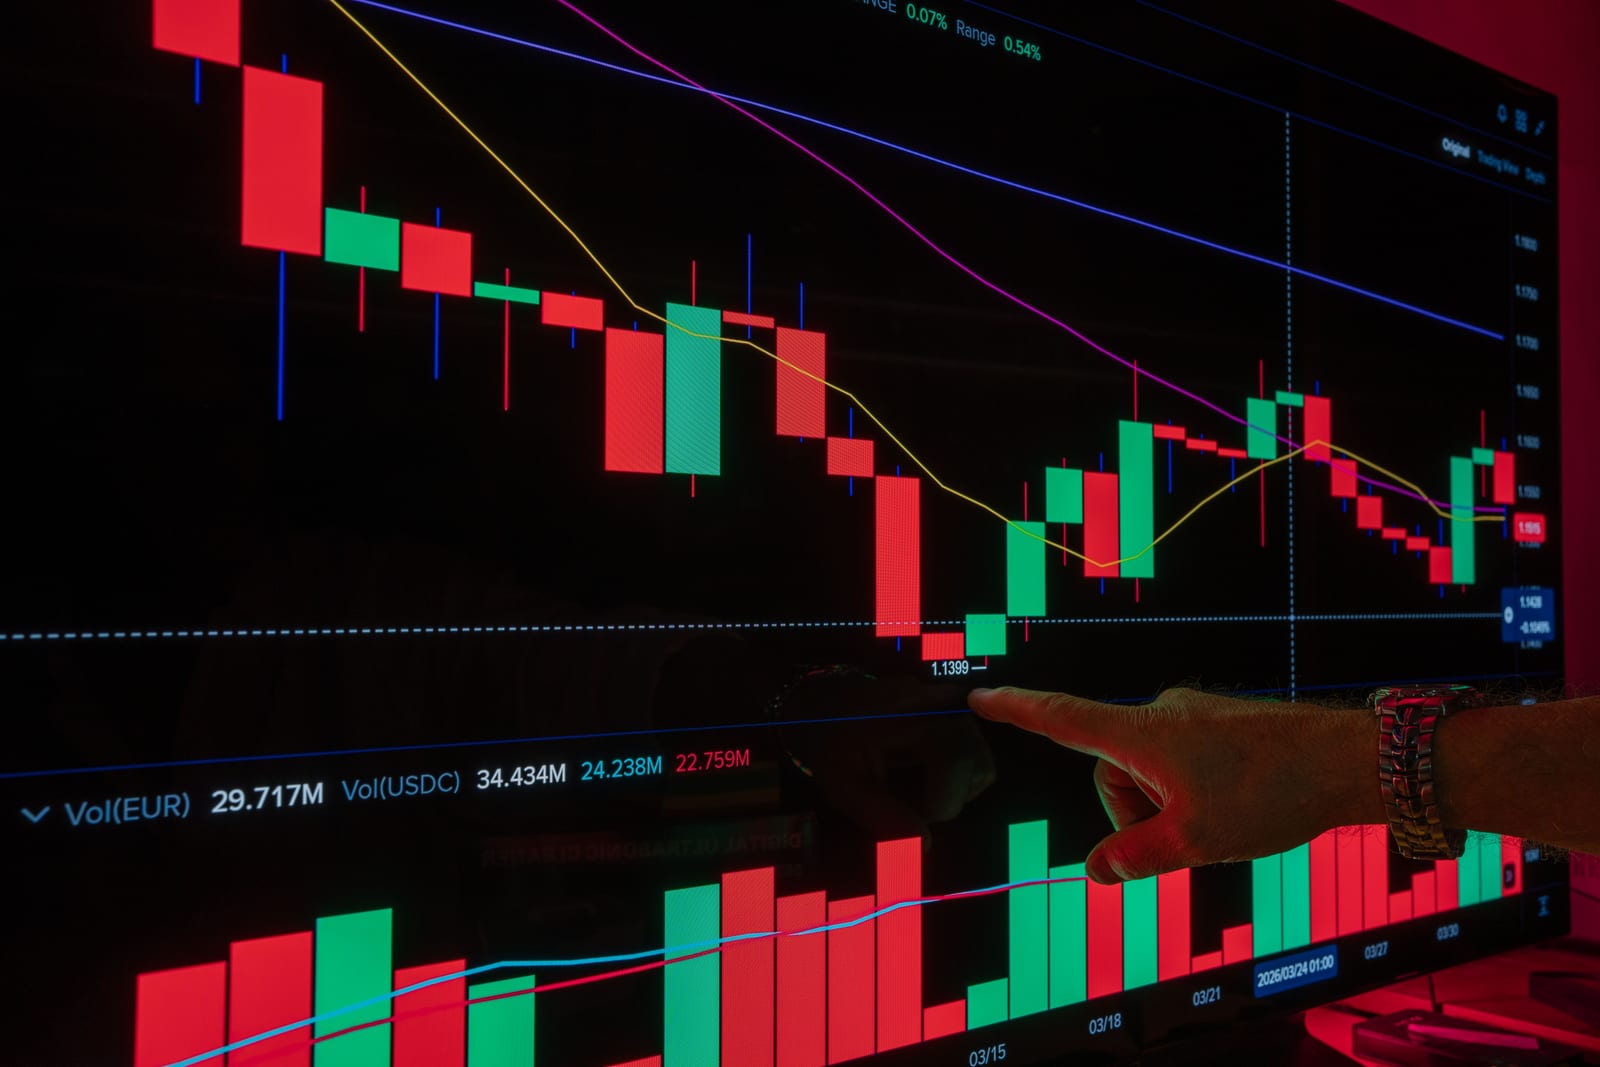
Candlestick charts are a popular choice among traders due to their visual appeal and detailed information. Each candlestick represents a specific time period and includes the same OHLC data as bar charts. The body of the candlestick is filled or hollow, indicating whether the price closed higher or lower than it opened.
- Pros: Provides a wealth of information at a glance, useful for identifying market sentiment and patterns.
- Cons: Can be overwhelming for beginners, requires practice to interpret effectively.
Key Indicators for Chart Analysis
To enhance your chart analysis, it's essential to incorporate various technical indicators. These indicators can help confirm trends, identify potential reversals, and provide insights into market conditions. Here are some key indicators to consider:
1. Moving Averages
Moving averages (MA) smooth out price data to identify trends over a specific period. The two most common types are:
- Simple Moving Average (SMA): The average price over a specified number of periods.
- Exponential Moving Average (EMA): Places more weight on recent prices, making it more responsive to new information.
Traders often use moving averages to identify support and resistance levels and generate buy/sell signals when short-term moving averages cross long-term ones.
2. Relative Strength Index (RSI)
The RSI is a momentum oscillator that measures the speed and change of price movements. It ranges from 0 to 100 and is typically used to identify overbought or oversold conditions:
- Above 70: Overbought conditions, potential price reversal.
- Below 30: Oversold conditions, potential price increase.
3. Moving Average Convergence Divergence (MACD)
The MACD is a trend-following momentum indicator that shows the relationship between two moving averages of an asset's price. It consists of:
- MACD Line: The difference between the 12-day EMA and the 26-day EMA.
- Signal Line: The 9-day EMA of the MACD line.
Traders often look for crossovers between the MACD line and the signal line to identify potential buy/sell signals.
4. Fibonacci Retracement
Fibonacci retracement levels are horizontal lines that indicate potential support and resistance levels based on the Fibonacci sequence. Traders use these levels to identify potential reversal points during a price pullback.
Practical Steps for Effective Chart Analysis
To effectively use chart analysis for market prediction, follow these practical steps:
Step 1: Choose Your Chart Type
Select the type of chart that best suits your trading style and the time frame you are analyzing. Candlestick charts are often recommended for their detail and clarity, especially for short-term trading.
Step 2: Set Up Your Indicators
Incorporate key indicators like moving averages, RSI, and MACD into your chart. Adjust their settings based on your trading strategy and the asset you are analyzing.
Step 3: Identify Trends
Analyze the chart to identify current trends. Look for higher highs and higher lows in an uptrend and lower highs and lower lows in a downtrend. Understanding the trend is crucial for making informed trading decisions.
Step 4: Look for Patterns
Identify chart patterns such as head and shoulders, triangles, and flags. These patterns can indicate potential reversals or continuations in price movements.
Step 5: Confirm with Indicators
Use your selected indicators to confirm your analysis. For example, if you identify a bullish pattern, check if the RSI is below 30 (oversold) or if the MACD line is crossing above the signal line to strengthen your case.
Step 6: Set Entry and Exit Points
Based on your analysis, set clear entry and exit points. Determine where you will enter a trade, set stop-loss orders to manage risk, and identify profit targets based on support and resistance levels.
Common Mistakes to Avoid in Chart Analysis
While chart analysis can be a powerful tool, it's essential to avoid common pitfalls:
- Overcomplicating Analysis: Using too many indicators can lead to confusion. Stick to a few reliable indicators that align with your strategy.
- Ignoring Market News: Technical analysis should be complemented with an understanding of market news and events that can impact price movements.
- Emotional Trading: Avoid making impulsive decisions based on emotions. Stick to your analysis and trading plan.
Conclusion
Chart analysis for market prediction is an invaluable skill for any serious trader. By understanding how to read and interpret charts, utilize key indicators, and identify patterns, you can enhance your trading strategy and make more informed decisions. At Trnd Tools, we provide comprehensive chart analysis tools designed to help you navigate the complexities of the crypto market effectively.
Call to Action
Ready to take your trading to the next level? Create a Free Account at Trnd Tools and start utilizing our powerful chart analysis features today!
FAQs
1. What is chart analysis in trading?
Chart analysis is a technique used by traders to evaluate historical price movements of assets through visual representations, enabling them to make predictions about future price movements.
2. How do I choose the right chart type for my trading?
The right chart type depends on your trading style. Candlestick charts are popular for their detailed information, while line charts are simpler and good for identifying long-term trends.
3. What are some common indicators used in chart analysis?
Common indicators include moving averages, Relative Strength Index (RSI), Moving Average Convergence Divergence (MACD), and Fibonacci retracement levels.
4. Can chart analysis guarantee successful trades?
While chart analysis can significantly enhance your trading strategy, it cannot guarantee success. It should be used in conjunction with sound risk management and market knowledge.
5. How can I improve my chart analysis skills?
Practice regularly by analyzing various charts, studying patterns, and keeping up with market news. Utilizing tools like those offered by Trnd Tools can also enhance your skills.
Put it into practice in a trade journal
Log your crypto trades in Trnd Tools and see your real win rate, profit factor and which setups actually pay. Free for up to 10 trades a month, with 30 days of Pro on signup and no card required.
Start journaling freeOr see the trade journal tour and the free trading calculators.