How to Analyse Market Trends in the Final Quarter of 2026
Learn how to analyse crypto market trends in November 2026 with a structured journal, risk controls, and real-time insights for year-end trading.

If you want to analyze crypto market trends November 2026 effectively, you need more than a quick scan of price candles. The final quarter of the year is usually where traders get careless: they overreact to headlines, chase late moves, or stop reviewing their own data just when market conditions shift the most. A structured process helps you separate noise from signal and make cleaner decisions.
The goal is not to predict the exact next move. It is to understand what the market is doing now, how that compares with recent behaviour, and whether your own trades are aligned with the conditions in front of you. That is where a trade journal, performance review, and real-time market context work together.
Why the final quarter needs a different review process
The last few months of the year often bring a change in behaviour. Liquidity can improve, then thin out again. Positioning can become more sensitive to macro headlines, exchange flows, funding, and sentiment shifts. Even when the market looks broadly directional, the quality of entries and exits can change very quickly.
That means your review process should become more selective. Instead of asking, “Is the market bullish or bearish?”, ask:
- Which assets are showing sustained relative strength or weakness?
- Are moves being driven by spot demand, derivatives positioning, or news flow?
- Is volatility expanding or contracting on the timeframes you trade?
- Are your best setups still performing, or has edge degraded?
This is the point where a tool like the Trnd Terminal matters, because you can keep market context and trade records in one place. If you are only looking at charts without reviewing your own fills and outcomes, you are missing half the picture.
Start with your own trade data, not the market narrative
Most traders begin by reading market commentary. That can be useful, but it is not where your edge is found. Your edge is in the repeatable patterns inside your own trading history.
Before you try to analyse broad year-end trends, review your closed trades from the last 30 to 90 days. Look for the patterns that show up in your journal, not the headlines that dominate social feeds.
Focus on these metrics:
- Win rate by setup
- Profit factor by asset
- Expectancy per trade
- R-multiple distribution
- MAE and MFE, if you track exit efficiency
- Results by hour, weekday, and market condition
If you already use the Trading Journal workflow on Trnd Tools, this becomes much easier because your exchange fills can be pulled in automatically, matched into closed positions, and organised into a ledger. That reduces the admin load and gives you a cleaner dataset to review.
The key question is simple: when the market changed, did your behaviour change with it? If your winners came mostly from one specific setup, and that setup has started to underperform, your first task is not to force more trades. It is to understand whether the market environment has shifted away from your edge.
Use a structured framework for trend analysis
When you analyse crypto trends in late 2026, avoid relying on one indicator or one timeframe. A better approach is to combine four layers of context.
1. Price structure
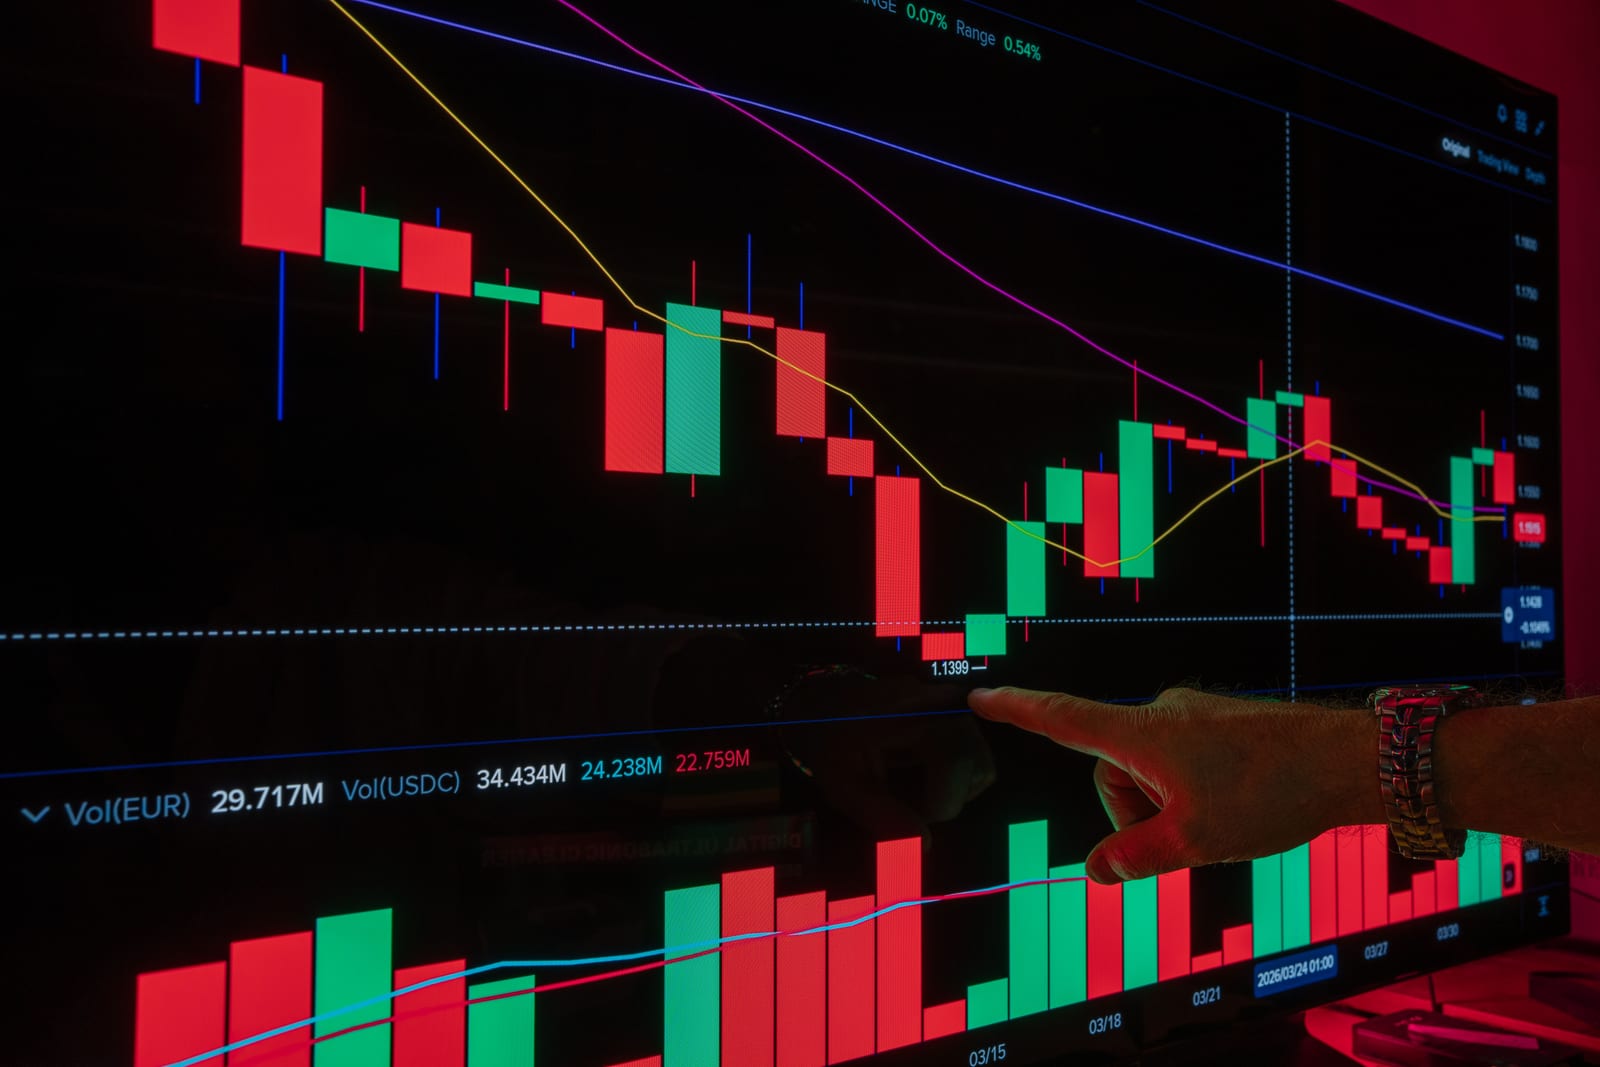
Start with the chart itself. Mark the obvious swing highs and lows on the daily and four-hour timeframes. Ask whether the market is making higher highs and higher lows, lower highs and lower lows, or simply rotating in a range.
You do not need a complicated model to do this well. You need consistency. If the market is trending but your entries keep arriving in the middle of extended moves, your problem may be timing, not analysis.
2. Market participation
Price alone can be misleading. You also want to know whether participation is increasing or fading. That is where open interest, volume behaviour, and sentiment shifts can help provide structure.
If a move is happening on weak participation, it may be less reliable than a move backed by broader engagement. If you use Trnd Tools Pro, the live market terminal helps you keep an eye on funding, open interest, RSI divergences, news, and Fear & Greed in one view, which is useful when conditions are changing quickly.
3. Macro context
You do not need to become a macro trader to use macro information well. You only need to understand whether broader conditions are supporting risk-taking or making traders defensive.
For example, if the market is already unstable and you are seeing frequent reversals, that may not call for a bullish or bearish forecast. It may call for smaller size, tighter invalidation, and more selective trade selection. That is a risk management decision, not a market call.
4. Your own execution quality
This is the part most traders skip. If the market is noisy, your execution quality matters more, not less. Review whether your entries are improving, whether you are giving trades enough room, and whether you are exiting too early or too late.
A good trend analysis process should always end with a performance check on your own behaviour.
A worked example: reviewing two trades in a changing market
Here is a simple example using two trades from a swing trader’s journal.
Trade 1
- Entry: $68,000
- Stop: $66,500
- Risk per trade: $1,500
- Target: $71,000
- Exit: $71,000
- Result: +$3,000
This trade made 2R, because the profit was twice the amount risked.
Trade 2
- Entry: $71,200
- Stop: $70,200
- Risk per trade: $1,000
- Exit: $70,400
- Result: -$800
This trade lost 0.8R.
Now look at the journal review:
| Trade | Setup | Market condition | Result |
|---|---|---|---|
| 1 | Breakout pullback | Trend continuation | +2R |
| 2 | Late entry after extension | Choppy follow-through | -0.8R |
The lesson is not that the market “turned bad”. The lesson is that the trader’s edge was strongest when trend continuation was clean, and weaker when they chased extended moves in choppier conditions.
That is exactly why performance tracking matters. If you use the position size calculator and the risk-reward calculator, you can translate this kind of review into better trade planning. You stop asking, “Can I be right?” and start asking, “Does this setup still justify the risk?”
What to watch in late-quarter crypto conditions
As the year closes, traders often focus too much on direction and not enough on behaviour. The trend itself matters, but the quality of the trend matters more.
Watch for these changes:
- Are rallies or sell-offs being accepted quickly, or rejected just as fast?
- Are large candles followed by continuation, or by immediate mean reversion?
- Is volatility making stops too tight, or are ranges compressing before expansion?
- Are certain assets leading while the rest of the market lags?
- Is sentiment aligned with price, or is there a clear disconnect?
You do not need to answer all of these perfectly. You need enough structure to know whether your usual setup still has room to work. If your journal shows that your best trades happen when price consolidates before expansion, then late-quarter volatility spikes may require fewer trades and more patience.
This is where the Market Insights pages and the platform’s structured approach can help you think more clearly. The objective is not more data. It is better organisation of the data you already need.
Use your journal to separate environment from error
One of the biggest mistakes traders make in the final quarter is blaming the market for every losing month. Sometimes the market really did change. Other times, your process drifted.
A good journal helps you distinguish between those two cases.
Review these questions in sequence:
- Did my setup quality deteriorate?
- Did I increase size after a good week?
- Did I take trades outside my plan because the market looked active?
- Did I hold losers longer when volatility expanded?
- Did I cut winners early because recent losses made me cautious?
If the answer to most of these is yes, the issue may be process discipline rather than market structure.
The trading journal template is useful here even if you already log trades elsewhere, because it gives you a clean way to document why you took a trade, not just what happened after entry. A strong journal entry should include the setup, timeframe, thesis, invalidation point, and emotional state at entry.
That information becomes especially valuable at year-end, when traders tend to make faster decisions and then forget why they made them.
How to turn year-end analysis into better risk control
Trend analysis is only useful if it changes what you do next. In the final quarter, the most practical adjustment is often risk control, not prediction.
If the market is trending cleanly:
- Keep your risk consistent
- Avoid adding size just because a move looks obvious
- Let your system define the exit
If the market is choppy:
- Reduce size if your setup quality drops
- Consider fewer trades and more patience
- Avoid forcing entries because you want to stay active
If you are using the Trnd Tools journal, you can check how different setups perform across asset, hour, and weekday. That helps you spot whether you are better off trading certain sessions or avoiding periods where your edge weakens.
This is a more reliable way to prepare for the rest of the year than trying to guess the next large move.
Build a simple year-end review routine
A practical routine is better than a complicated one. At the end of each week, review your trading from three angles: market, execution, and risk.
Use this checklist:
- What was the dominant market structure this week?
- Which of my setups worked best?
- Which entries were late, emotional, or poorly sized?
- Did I follow my stop-loss rules?
- Did I review the trades soon enough after closing them?
Then summarise the week in one paragraph. Do not try to write a perfect report. Write enough to capture what you would need to know if you came back to it later.
By late November and December, that habit will tell you more about your trading than any single indicator. It will also make the transition into the first quarter of 2027 cleaner, because you will already know which behaviours were helping and which were costing you performance.
FAQ: analysing crypto trends and trade journals in the final quarter
How often should I review my trades in November and December?
Weekly review is usually the minimum if you are active. If you trade more frequently, you may want a short daily note and a deeper weekly review. The point is to catch behaviour changes quickly, while the details are still fresh.
What is the best way to know whether the market has changed or my strategy has weakened?
Compare your recent results with your historical journal data. If the setup used to perform well and now underperforms across several trades, the market environment may have changed. If the losses are tied to late entries, poor sizing, or rule breaks, the issue is more likely execution.
Should I use more indicators when the market gets volatile?
Not necessarily. More indicators can create more noise, especially when conditions are changing fast. A cleaner process is to focus on structure, participation, and your own trade data, then use a small number of tools consistently.
How can I improve performance without taking more trades?
Review your journal for setup quality, not trade count. You may find that one or two specific setups account for most of your profitable R-multiples. If that is the case, improving performance may simply mean taking fewer low-quality trades and focusing on the conditions where your edge is strongest.
Is a trade journal still useful if I already sync my exchange account?
Yes. Auto-sync saves time, but the real value comes from reviewing the outcomes. A journal turns raw fills into usable performance data, so you can assess expectancy, exit efficiency, and consistency over time.
Final takeaways for the last quarter of 2026
If you want to analyse crypto trends well in the final quarter, stay grounded in process. Start with your own data, then layer in market structure, participation, and macro context. Keep your review simple enough to repeat, and detailed enough to reveal what is really driving your performance.
The traders who do best at year-end are not usually the ones who guess the move correctly. They are the ones who notice when the market changes, adjust risk accordingly, and document what actually happened.
If you want a cleaner way to review your trades, create your free account and start logging your market data in Trnd Tools.
Put it into practice in a trade journal
Log your crypto trades in Trnd Tools and see your real win rate, profit factor and which setups actually pay. Free for up to 3 trades a month, with 14 days of Pro on signup and no card required.
Start journaling freeOr see the trade journal tour and the free trading calculators.